

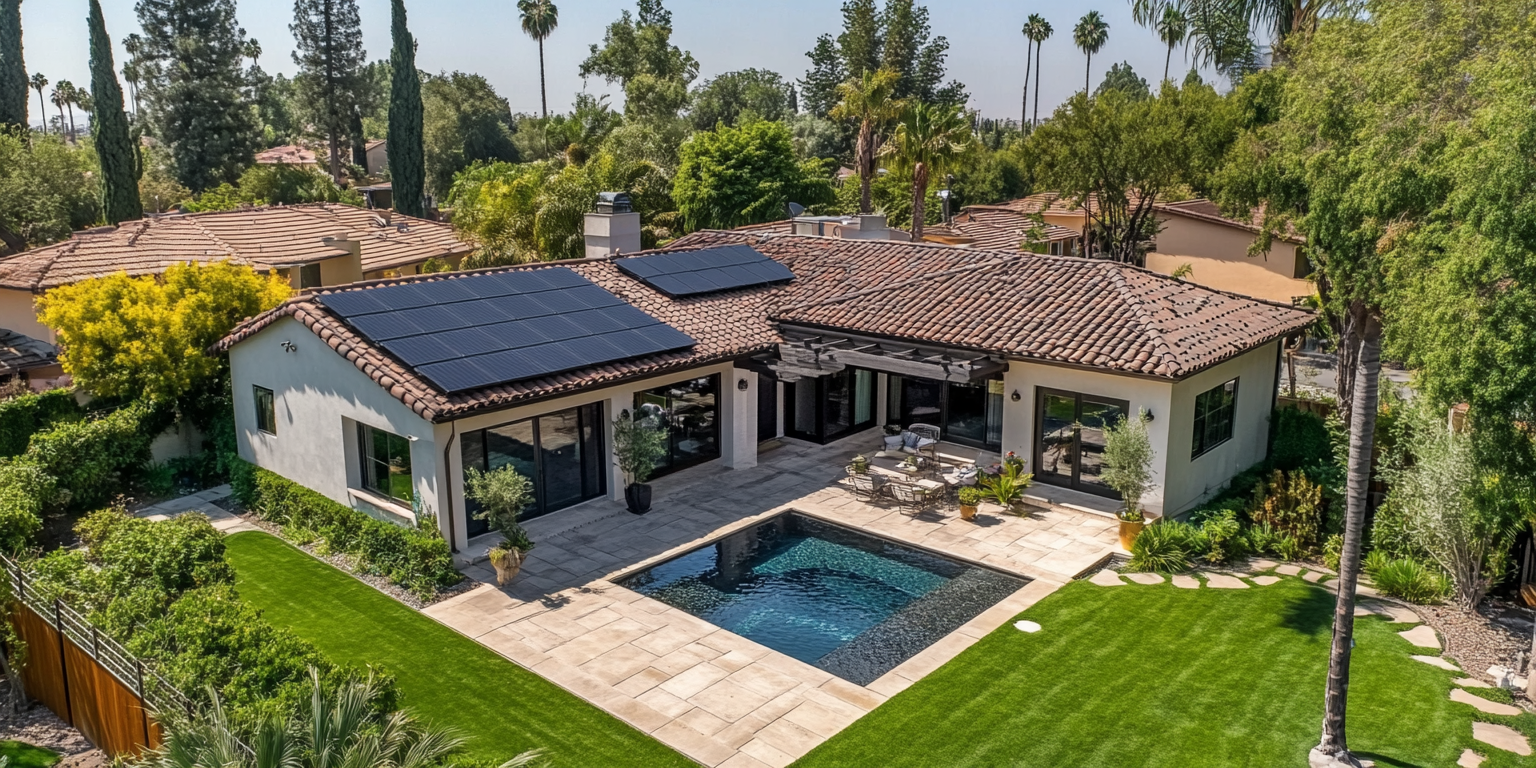
To size a solar system, divide the customer's annual kWh by the site's specific yield, which is the kWh one kW of DC modules produces in a year, then adjust for roof area, shade and inverter limits. In Florida, PVWatts returns about 1,500 kWh per kW DC per year for a south-facing roof array with default losses, so a home that uses 12,000 kWh a year needs roughly 8 kW DC. Tilt near latitude and a south azimuth give the best annual output, but in Orlando every tilt from 10 to 45 degrees lands within about 4% of the best angle. Shade is the bigger risk, and module-level electronics recover only part of what it costs.
Key takeaways
- System size in kW DC equals annual kWh times the target offset, divided by the site's kWh per kW DC from PVWatts or SAM.
- PVWatts treats shading as a single loss percentage, so a measured shade analysis has to replace its 3% default on any roof with nearby trees or obstructions.
- Orlando output stays within about 4% of the maximum for any fixed tilt from 10 to 45 degrees, so roof pitch rarely justifies a tilt kit.
- Azimuth matters more than tilt on low-pitch roofs: a due-west array at 20 degrees gives up roughly 14% against due south in a PVGIS run for Orlando.
- Module-level power electronics recovered 25 to 35% of shading losses in the NREL and PVEL testbed, so they reduce shade losses without erasing them.
- Treat AI-generated layouts as drafts. Setbacks, attachment spacing and string limits still need an engineer's check.
How do you size a solar system for a specific energy demand?
Start with 12 months of utility bills, convert the annual use to kWh, pick an offset target, and divide by the site's specific yield. The result is the DC array size. Then check it against usable roof area, the utility's interconnection limits and the inverter you plan to use.
A worked example, Orlando:
- Annual use from the bills: 12,000 kWh.
- Target offset: 100%.
- Specific yield: about 1,500 kWh per kW DC per year (PVWatts, south-facing, 20 degrees, default losses, rounded down for real-world shade and soiling).
- Array size: 12,000 ÷ 1,500 = 8.0 kW DC.
- Module count: 8,000 W ÷ 430 W modules = about 19 modules, so a contractor would quote 19 or 20.
Three things change the answer. First, planned loads: a heat pump, EV charger or pool pump that the customer has already bought belongs in the number, even if last year's bill doesn't show it. Second, how the utility pays for exports. Florida's net-metering rule (PSC Rule 25-6.065) has not changed since 2008, so full-retail net metering continues there and sizing to 100% of use is usually sound. California's Net Billing Tariff has applied since interconnection applications filed from April 15, 2023, which pushes designs toward self-consumption and storage. Third, physical limits: a roof that fits 14 modules caps the size no matter what the bill says.
Upsizing makes sense when the customer expects load growth and the utility allows it. Downsizing is a budget call, and the customer should hear what they give up. For the utility side, see net metering and interconnection. For batteries, see the battery storage design guide.
How do you estimate annual production with PVWatts or SAM?
Run the site through the National Laboratory of the Rockies (NLR, formerly NREL) PVWatts Calculator for a quick annual and monthly estimate, then use the System Advisor Model (SAM) when you need hourly simulation, degradation or financial modeling. PVWatts is free, takes location, system size, module type, array type, losses, tilt, azimuth and DC-to-AC ratio, and returns monthly and annual AC kWh.
The loss input is where most estimates go wrong. The PVWatts v5 documentation builds its 14% default from soiling (2%), shading (3%), mismatch (2%), wiring (2%), connections (0.5%), light-induced degradation (1.5%), nameplate rating (1%) and availability (3%), combined multiplicatively rather than added. The same document says the 3% shading figure represents distant horizon objects on an unshaded system, and that nearby trees or structures should replace it with a value from shading software or an on-site survey.
Specific yield varies a lot by site. These are PVWatts v8 results for 1 kW DC, fixed roof mount, 20 degrees, due south, 14% losses and a standard module, run on 2026-11-06:
| Location | Annual AC output (kWh per kW DC) |
|---|---|
| Phoenix, AZ | about 1,755 |
| Denver, CO | about 1,595 |
| Orlando, FL | about 1,545 |
| Seattle, WA | about 1,090 |
PVWatts is built for preliminary work, so a lender reviewing a large commercial system will usually want a SAM or PVsyst report behind it.
What tilt and orientation produce the most energy?
For a fixed array in the northern hemisphere, face true south and tilt close to the site's latitude. In Florida that means a tilt of roughly 25 to 30 degrees, but the curve is flat near the top, so a 5/12 or 6/12 roof pitch (about 22 to 27 degrees) is already within 1% of the maximum.
This is the tilt sweep for Orlando (PVWatts v8, premium module, fixed roof mount, due south, 14% losses, 1 kW DC, run on 2026-11-06):
| Tilt | Annual AC output (kWh per kW DC) | Share of best angle |
|---|---|---|
| 0 degrees (flat) | 1,402 | 90% |
| 10 degrees | 1,492 | 96% |
| 20 degrees | 1,542 | 99% |
| 28 degrees | 1,554 | 100% |
| 35 degrees | 1,543 | 99% |
| 45 degrees | 1,495 | 96% |
A flat array loses about a tenth of its output against the best tilt, and anything from 10 to 45 degrees stays within about 4%. That is why tilt-up kits on pitched roofs rarely pay back, and why low-tilt, high-density layouts on flat commercial roofs often win.
Azimuth is a bigger lever. A PVGIS run from the European Commission's Joint Research Centre for Orlando at 20 degrees tilt and 14% losses gives these relative outputs (the ERA5 weather set is the tool's default for this location, so read the figures as relative, not absolute):
| Roof faces | Output vs due south |
|---|---|
| South | 100% |
| Southeast | 99% |
| Southwest | 95% |
| East | 91% |
| West | 86% |
| Northeast | 81% |
| Northwest | 77% |
| North | 74% |
Two practical points follow. A roof that faces east or west loses 9 to 14%, which many customers accept for the added roof area. And a west or southwest orientation can still be the right choice when the rate is higher in the late afternoon, because those kWh are worth more. Seasonal tilt adjustment, which the older posts recommend, adds a few percent at most and rarely survives past the first season, so fixed tilt is the standard design. Trackers are a ground-mount decision covered in the racking and ground mount guide.
How is a shading analysis done, and what tools work?
A shading analysis measures how much of the year each part of the array loses to obstructions, then feeds that into the production model. The result is usually a solar access percentage or a total solar resource fraction (TSRF) for each roof plane, and a monthly shade loss for the energy model.
There are three common methods:
- On-site survey. A Solar Pathfinder or a similar horizon tool, plus photos and a measured tree and obstruction survey. This is the check against which the others are judged.
- 3D modeling from imagery or LiDAR. Design platforms build the roof and nearby trees in 3D and run the sun path hour by hour. Accuracy depends on the tree heights in the model, which you should confirm on site.
- Manual geometry. Shadow length from solar altitude and azimuth. It is useful for flat-roof row spacing and for checking a software result.
Evaluate the worst realistic case. The sun is lowest on December 21, and a common design rule is to keep modules clear of shade from about 9 a.m. to 3 p.m. all year. On flat roofs, row spacing comes from the winter-sun shadow length: a steeper tilt needs more spacing and fits fewer modules.
Can partial shading cut the output of an entire array?
Yes, in a string design it can. Modules in a string carry the same current, so the most shaded module sets the pace for the whole string unless bypass diodes route around it. The result depends on how the modules are wired and where the shadow falls.
Most conventional modules have three bypass diodes, each protecting a third of the cells. When a shadow covers part of one third, that third drops out and the module delivers roughly two thirds of its power, and the string keeps running. When the shadow crosses all three thirds, as a roof-edge or chimney shadow can across the bottom of portrait-oriented modules, the module contributes almost nothing and the string current suffers. Half-cut cell modules and different substring layouts change the details, so check the datasheet.
Your options, from simplest to most expensive:
| Fix | What it does | Limits |
|---|---|---|
| Remove or trim the obstruction | Eliminates the loss | Needs owner permission, trees regrow |
| Change layout | Keeps shade on one string or one MPPT input | Fewer modules or a split array |
| Separate MPPT inputs by roof plane | Keeps a shaded plane from dragging a sunny one | Inverter must have enough inputs |
| Microinverters or optimizers on shaded modules | Each module operates at its own power point | Cost per module, more devices on the roof |
The NREL and PV Evolution Labs shading testbed update tested equipment from Enphase, SolarEdge, Maxim Integrated and SMA and found an annual recovery of shading losses of 25 to 35%. That is a real gain, and it also shows that electronics reduce shade losses rather than remove them.
Design for the mature tree, not today's. The equipment guide covers when module-level electronics earn their cost.
Which design software do installers and engineers use?
Most shops use a PV design platform for layouts and proposals, PVWatts for fast checks and SAM or PVsyst for detailed yield studies. The right pick depends on project size and who reviews the output.
| Tool | Best for | Notes |
|---|---|---|
| PVWatts | Quick site yield | Free from NLR, preliminary accuracy, losses entered as one number |
| SAM | Hourly simulation and project finance | Free from NLR, handles PV, storage and many other technologies |
| PVsyst | Detailed yield and loss studies | Desktop tool common in financing reviews, steeper learning curve |
| Aurora, HelioScope, OpenSolar | Roof layouts, 3D shade, proposals | Plans and pricing change, so check each vendor before you commit |
| HOMER | Microgrid and hybrid sizing | Aimed at storage and off-grid cases rather than standard grid-tied PV |
Two cautions. Each platform's production number depends on its weather source and loss assumptions, so compare it against PVWatts as a sanity check. And a clean auto layout can still violate fire setbacks or string voltage limits, so someone must review it before it goes into a permit set.
What design practices raise yield the most?
The biggest gains come from avoiding losses rather than chasing small efficiency edges. These are the items that move the number on real projects:
- Use measured shade. Replace PVWatts' 3% default with the survey number. This single input changes more estimates than any other.
- Keep strings electrically matched. Group modules by roof plane and shade condition, and do not mix orientations on one MPPT input.
- Check string voltage at both temperature extremes. Cold-weather open-circuit voltage must stay under the inverter and NEC 690.7 limits, and hot-weather operating voltage must stay above the inverter's MPPT minimum.
- Pick a sensible DC-to-AC ratio. Ratios of about 1.1 to 1.3 are common. Higher ratios add some clipping at midday and lift output in the morning and evening.
- Cap DC voltage drop. Wire runs are covered in the NEC and permit guide. Monitoring then catches string faults and soiling, which PVWatts assumes at 2%.
Does AI or machine learning help with system design?
It helps with speed and with monitoring, and it does not replace engineering review. Today's useful applications are automatic roof and obstruction detection from aerial imagery, draft module layouts, shade estimates, short-term production forecasting for aggregators and utilities, and anomaly detection in monitoring data that flags underperforming strings.
What it cannot do is take responsibility for the stamped design. A machine-generated layout does not know that the AHJ requires a 3-foot pathway or that a rafter is overstressed. Use these tools to draft and flag, then check setbacks, attachment spacing and string and conductor sizing as you would on any manual design.
FAQ
Should I size every system to 100% of the customer's usage?
Not automatically. Full offset is a good default where net metering pays retail rates, but a limited roof, a utility size cap, or a low export rate can make 70 to 90% the better design. Size to the economics the tariff supports and the roof allows.
What DC-to-AC ratio is normal for residential and commercial systems?
Most designs fall between 1.1 and 1.3. Higher ratios increase clipping at peak sun but add energy at the edges of the day, and they let you use a smaller inverter for the same array.
How closely does PVWatts match real production?
PVWatts models a typical weather year with default losses, so any real year will run above or below it. Treat it as a planning estimate and compare it with the first full year of monitoring data, then adjust the loss assumptions on later projects in the same region.
Do east-west arrays make sense?
On low-slope commercial roofs, often yes. Low-tilt east-west racking fits more modules per square foot and spreads output across the day, at the cost of some peak production. On a pitched roof you usually take the orientation the roof gives you.
Bottom line
Size from the annual kWh and the site's specific yield, check the result against roof area and the utility's rules, and treat shade as a measured input instead of a default. Tilt near latitude and a south azimuth are the starting point, but pitch and tilt matter less than orientation and shade. Use PVWatts for the quick check, SAM or PVsyst for anything that gets financed, and keep a person responsible for the final layout.
SunSmart Engineering designs and stamps PV plan sets for contractors in all 50 states.
Keep reading.
Have a project in mind?
Tell us what you're building and we'll help you get it engineered, sealed, and permitted.